I’ve been diving into deep learning methods during the course of my PhD, which focuses on analyzing audio and video data to uncover patterns relevant to the dolphin communication. I obtained a NVIDIA Titan Z through an academic hardware grant and installed Caffe to run jobs on the GPU using Python.
As a first step, I have been utilizing Caffe’s implementation of AlexNet (original paper) to tackle dolphin detection in video using R-CNN (by Ross B. Girshick) and classifying whale calls in audio (work presented at DCLDE 2015).
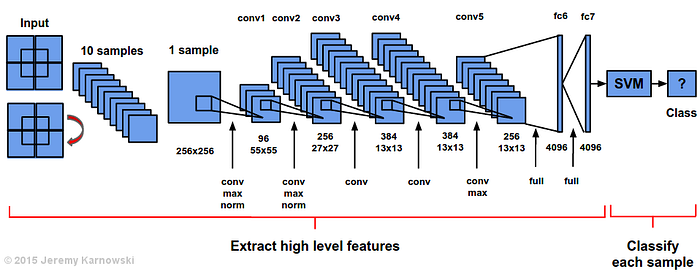
AlexNet + SVM (layer details and inspiration for configuration)
For the conference presentation and eventually for my dissertation defense, I wanted to make use of a visualization of AlexNet. I was unable to find a satisfying visualization other than the original:
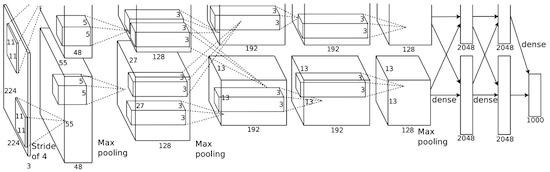
AlexNet from ImageNet 2012 (Implemented on 2 GPUs)
Another visualization of AlexNet is the graphical view (below), which also provides the difference between the original AlexNet and Caffe’s implementation (CaffeNet):
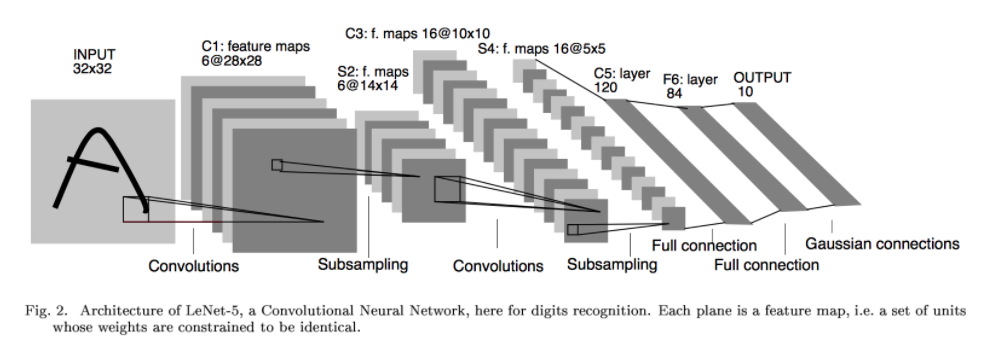
What I was really looking for was a visualization of AlexNet similar to the ones that exist for LeNet:
Here is my current visualization of AlexNet + SVM, a configuration I have been using for my specific classification tasks. I hope this can be useful for other researchers (give me a shout out someday) and I hope to update the image if anyone has helpful comments. Enjoy!
If you use this image in an academic context, please cite it. Thanks!
@MISC{karnowski:alexnet,
author = {Karnowski, Jeremy},
title = {AlexNet + SVM},
year = {2015},
note = {Online; accessed INSERT DATE},
url = {https://jeremykarnowski.files.wordpress.com/2015/07/alexnet2.png}
}