In July 2015, I attended DCLDE 2015 (Detection, Classification, Localization, and Density Estimation), a week-long workshop focusing on methods to improve the state of the art in bioacoustics for marine mammal research.
While I was there, I had a conversation with Tyler Helble about efforts to detect and classify blue whale and fin whale calls recorded off the coast of Southern California. While most researchers use Receiver Operating Characteristic (ROC) curves or Precision Recall (PR) curves to display classifier performance, one metric we discussed was Detection Error Tradeoff (DET) curves [1]. This might be a good metric when you are doing a binary classification problem with two species and you care how it is incorrectly classifying both species. This metric has been used several times in speech processing studies and has been used in the past to look at classification results for marine bioacoustics [2].
I typically program in Python and use the scikit-learn package for machine learning problems. They have an extensive listing of classification metrics, but I noticed the absence of DET curves. I had never created a pull request for a well known python package before, but I thought I would give it a try: DET curve pull request (as of writing this, there still remains some work to be done on the documentation). For those of you who are interested in doing something similar, here is how to contribute to scikit-learn.
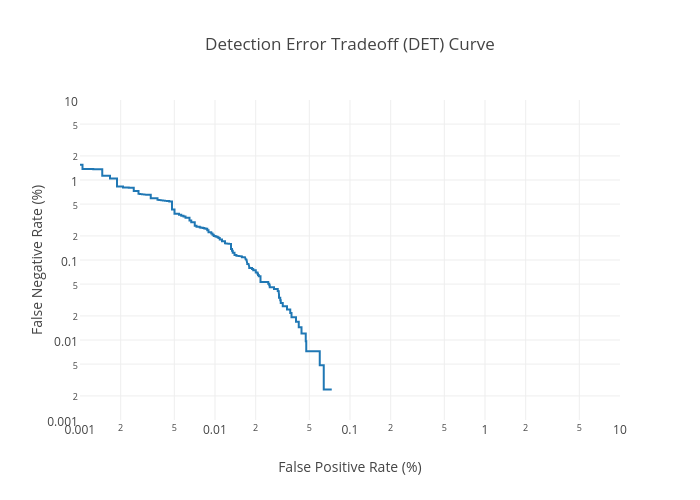
The detection_error_tradeoff function, which takes in a list of prediction values and a list of truth values, produces an output containing the false positive rate (FPR) and false negative rate (FNR) for all threshold values. The DET curve, the line showing the tradeoff between FPR and FNR, is typically viewed in a log-log plot. While Python can easily alter its axes, the default graph does not display the typical tick values as shown in standard speech processing DET curves: 0.1, 0.2, 0.5, 1, 2, 5, 10, 20, 50. In order to create a plot like this, I created the function DETCurve below. An obvious improvement would be for the function to automatically determine the lower bounds for the ticks and adjust accordingly. The alterations to the axes are necessary to ensure matplotlib does not try to plot zero on the log plot (which would set it to infinity and cause issues).
Whereas I had to adjust a lot of things manually in matplotlib, the fancier looking Plotly automatically uses the tick marks associated with plots of this kind:
References
- Martin, Doddington, Kamm, Ordowski, Przybocki (1997) The DET Curve in Assessment of Detection Task Performance. Available: http://www.itl.nist.gov/iad/mig/publications/storage_paper/det.pdf
- Potter, Mellinger, Clark (1994) Marine mammal call discrimination using artificial neural networks. Available: ftp://ftp.pmel.noaa.gov/newport/mellinger/papers/PotterEtAl94-BowheadCallNeuralNet.pd